Role
3rd Year Student
Timeline
Spring 2023: 4 Weeks
Description
This project revolved around exploring the design process. Our topic for this class was emerging technology. Through this project, I explored different methods of organizing and presenting my group's findings. My group included 1 Visual Designer, 1 Interior Designer, and 1 Industrial Designer.
The Messy Front End
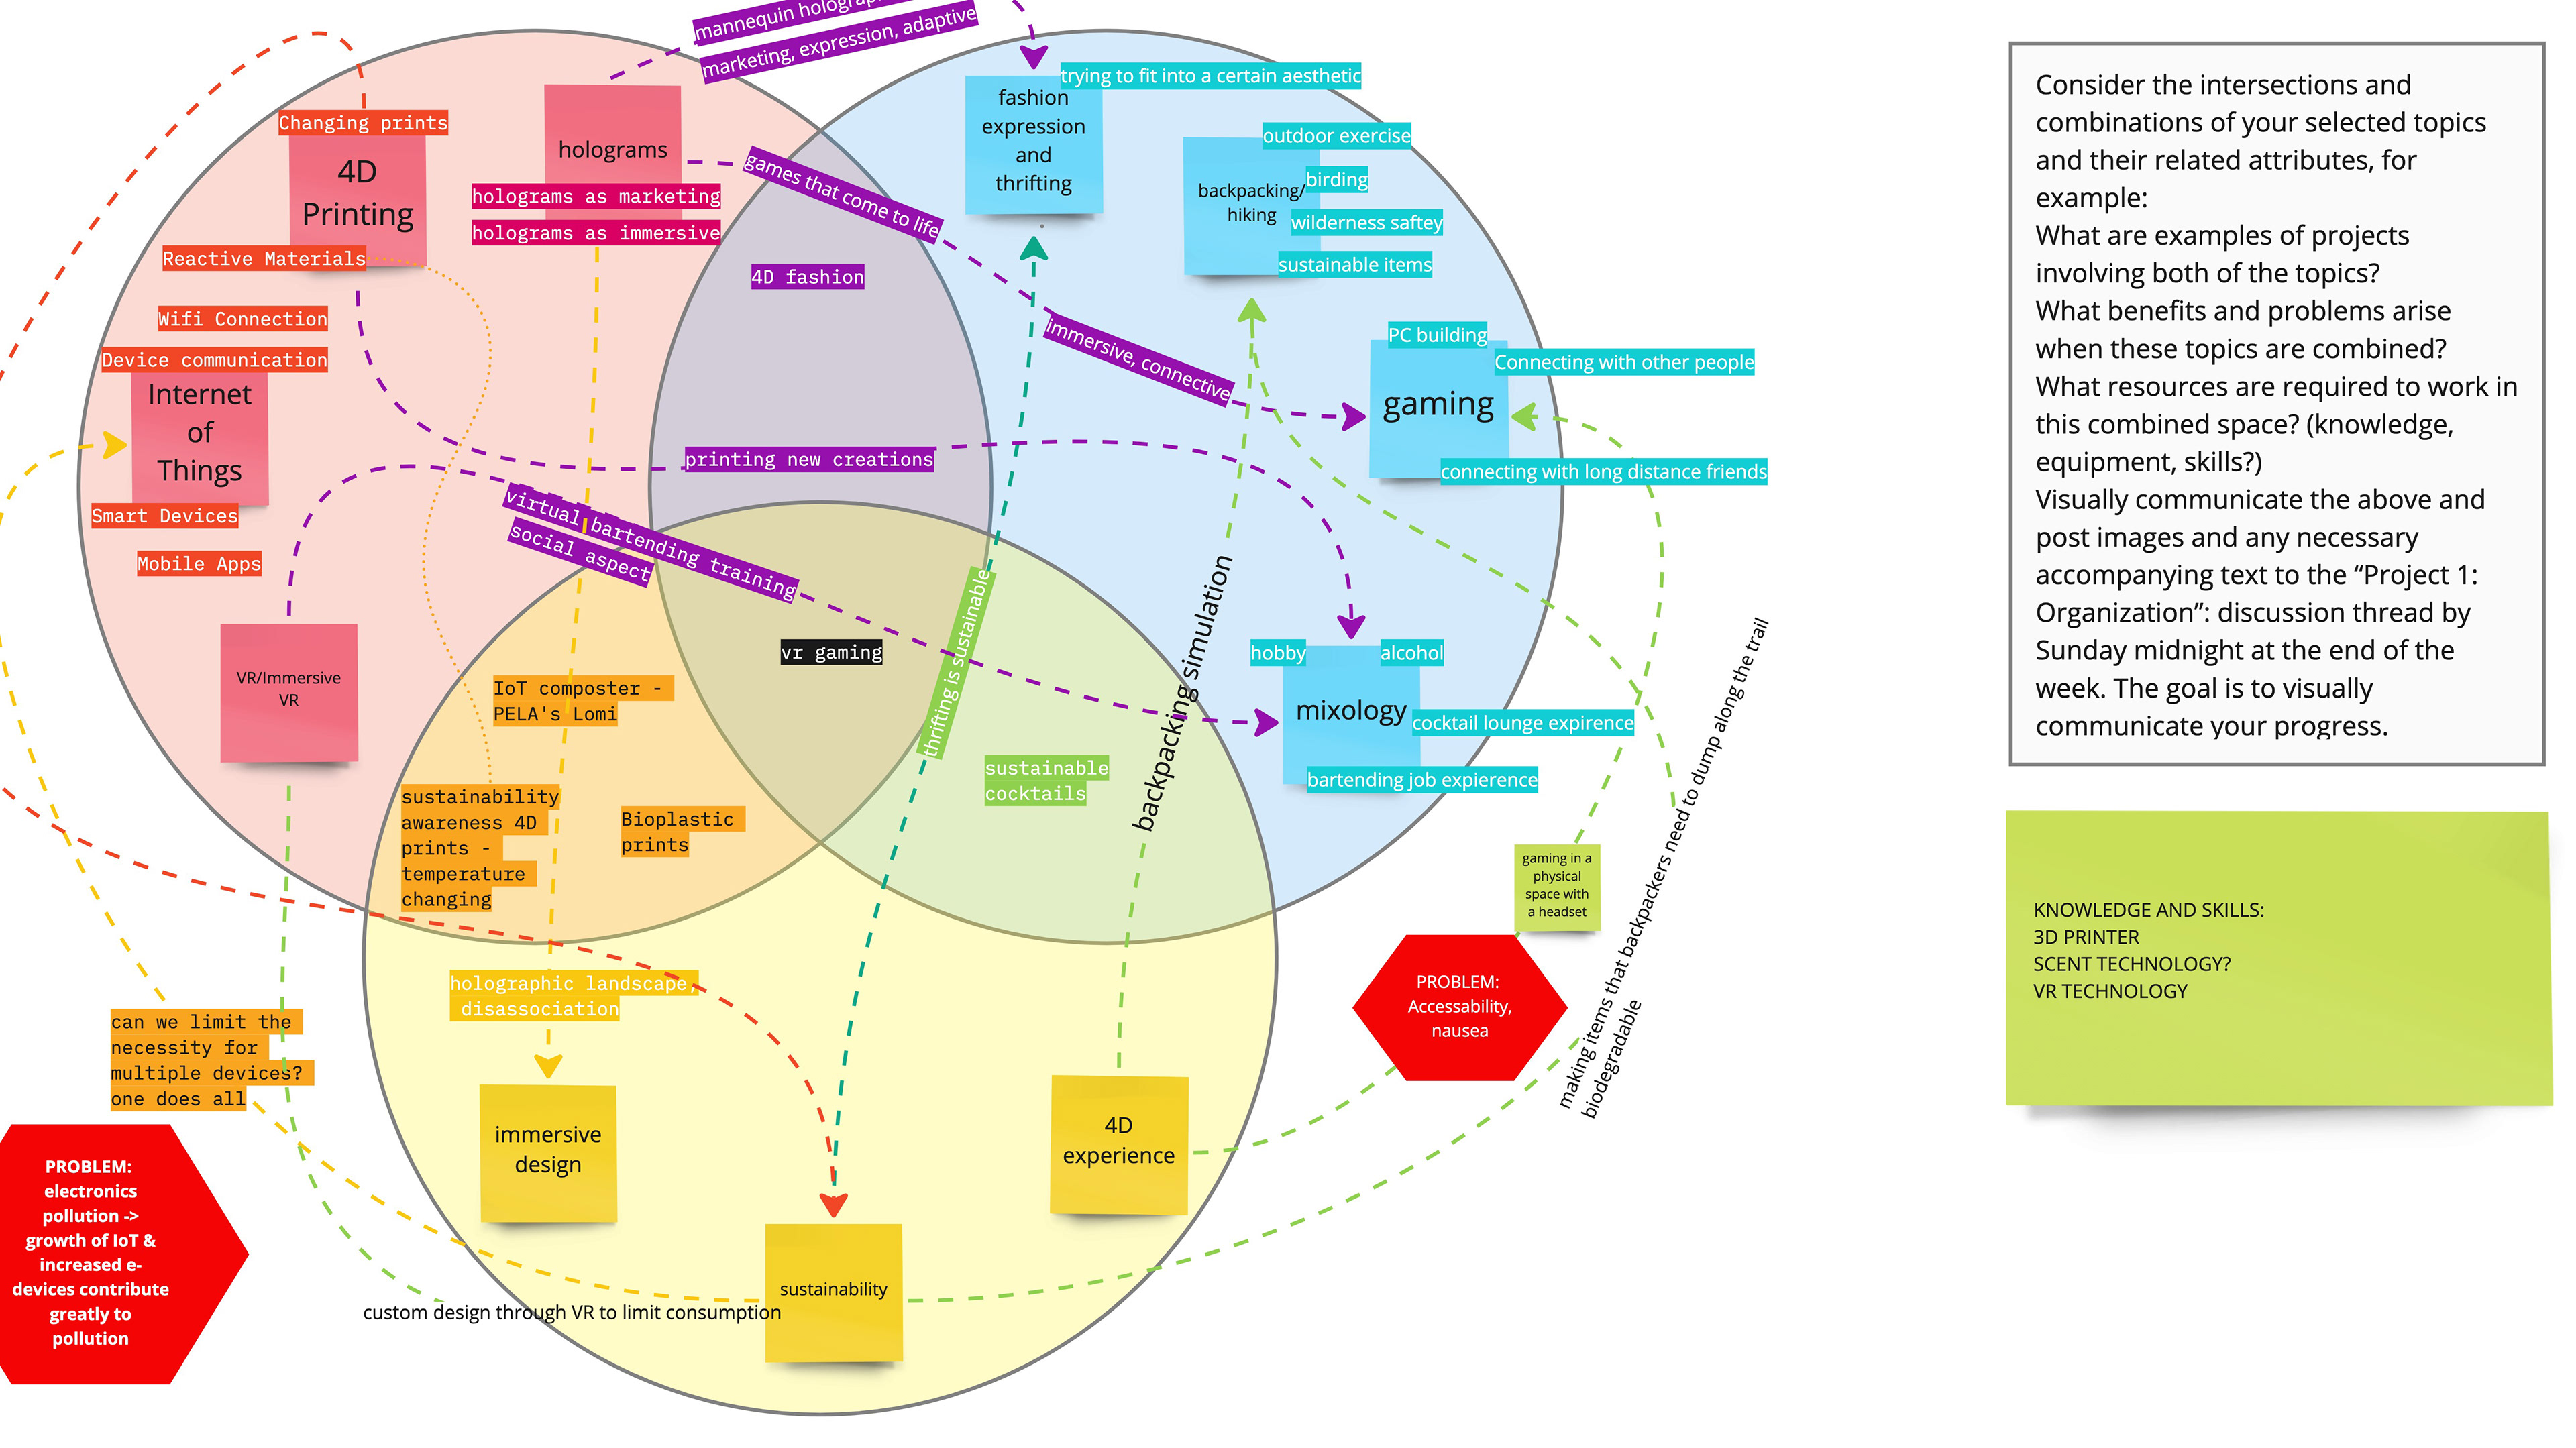
The above Miro Board shows the exploration phase of my group's project. We started with finding unfamiliar or emerging technology we were curious about, design topics were interested in, and our interest. During this process, I noted that I was interested in immersive virtual reality, and extended reality in general. For design topics, I wrote that UX and the 4D experience interested me. In the interest category, I put sticky notes for the outdoors, fantasy stories, and gaming.
For the rest of that week, we collected images related to our chosen topics and continued to do more in-depth research. From our assortment of topics, we decided to choose 3-4 subjects in each category to hone in on.
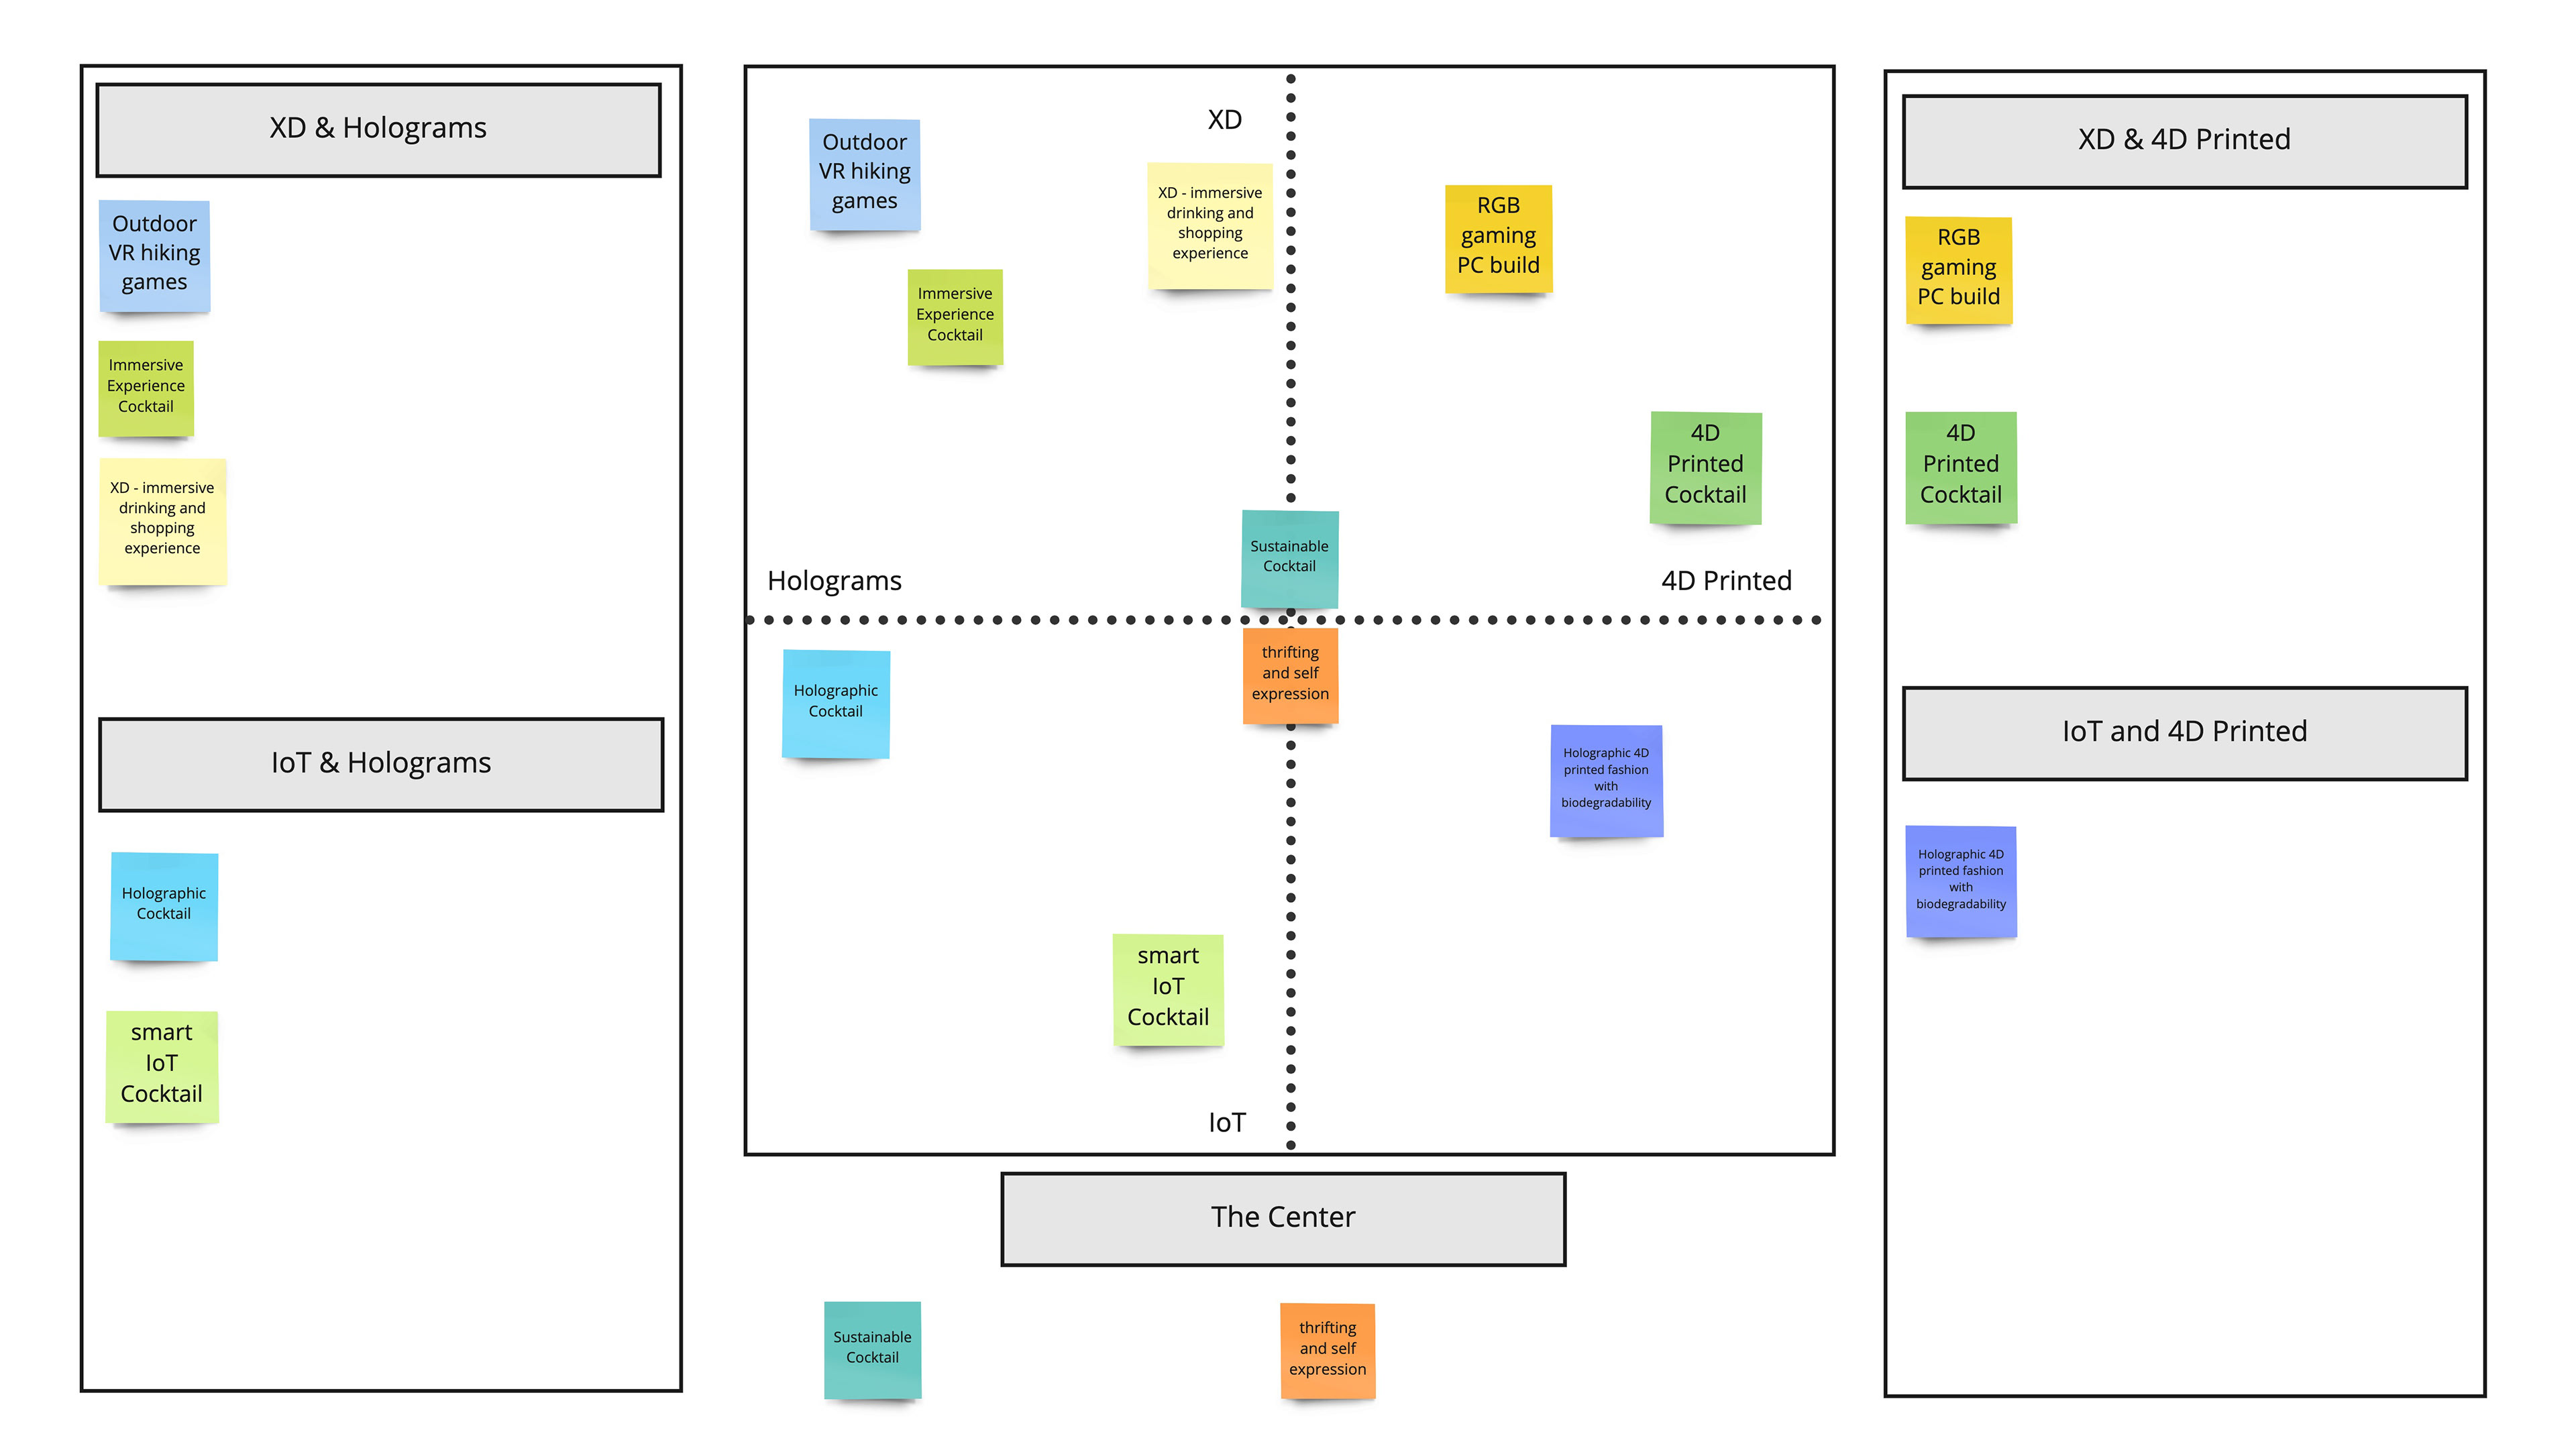
Organizing & Brainstorming Part II
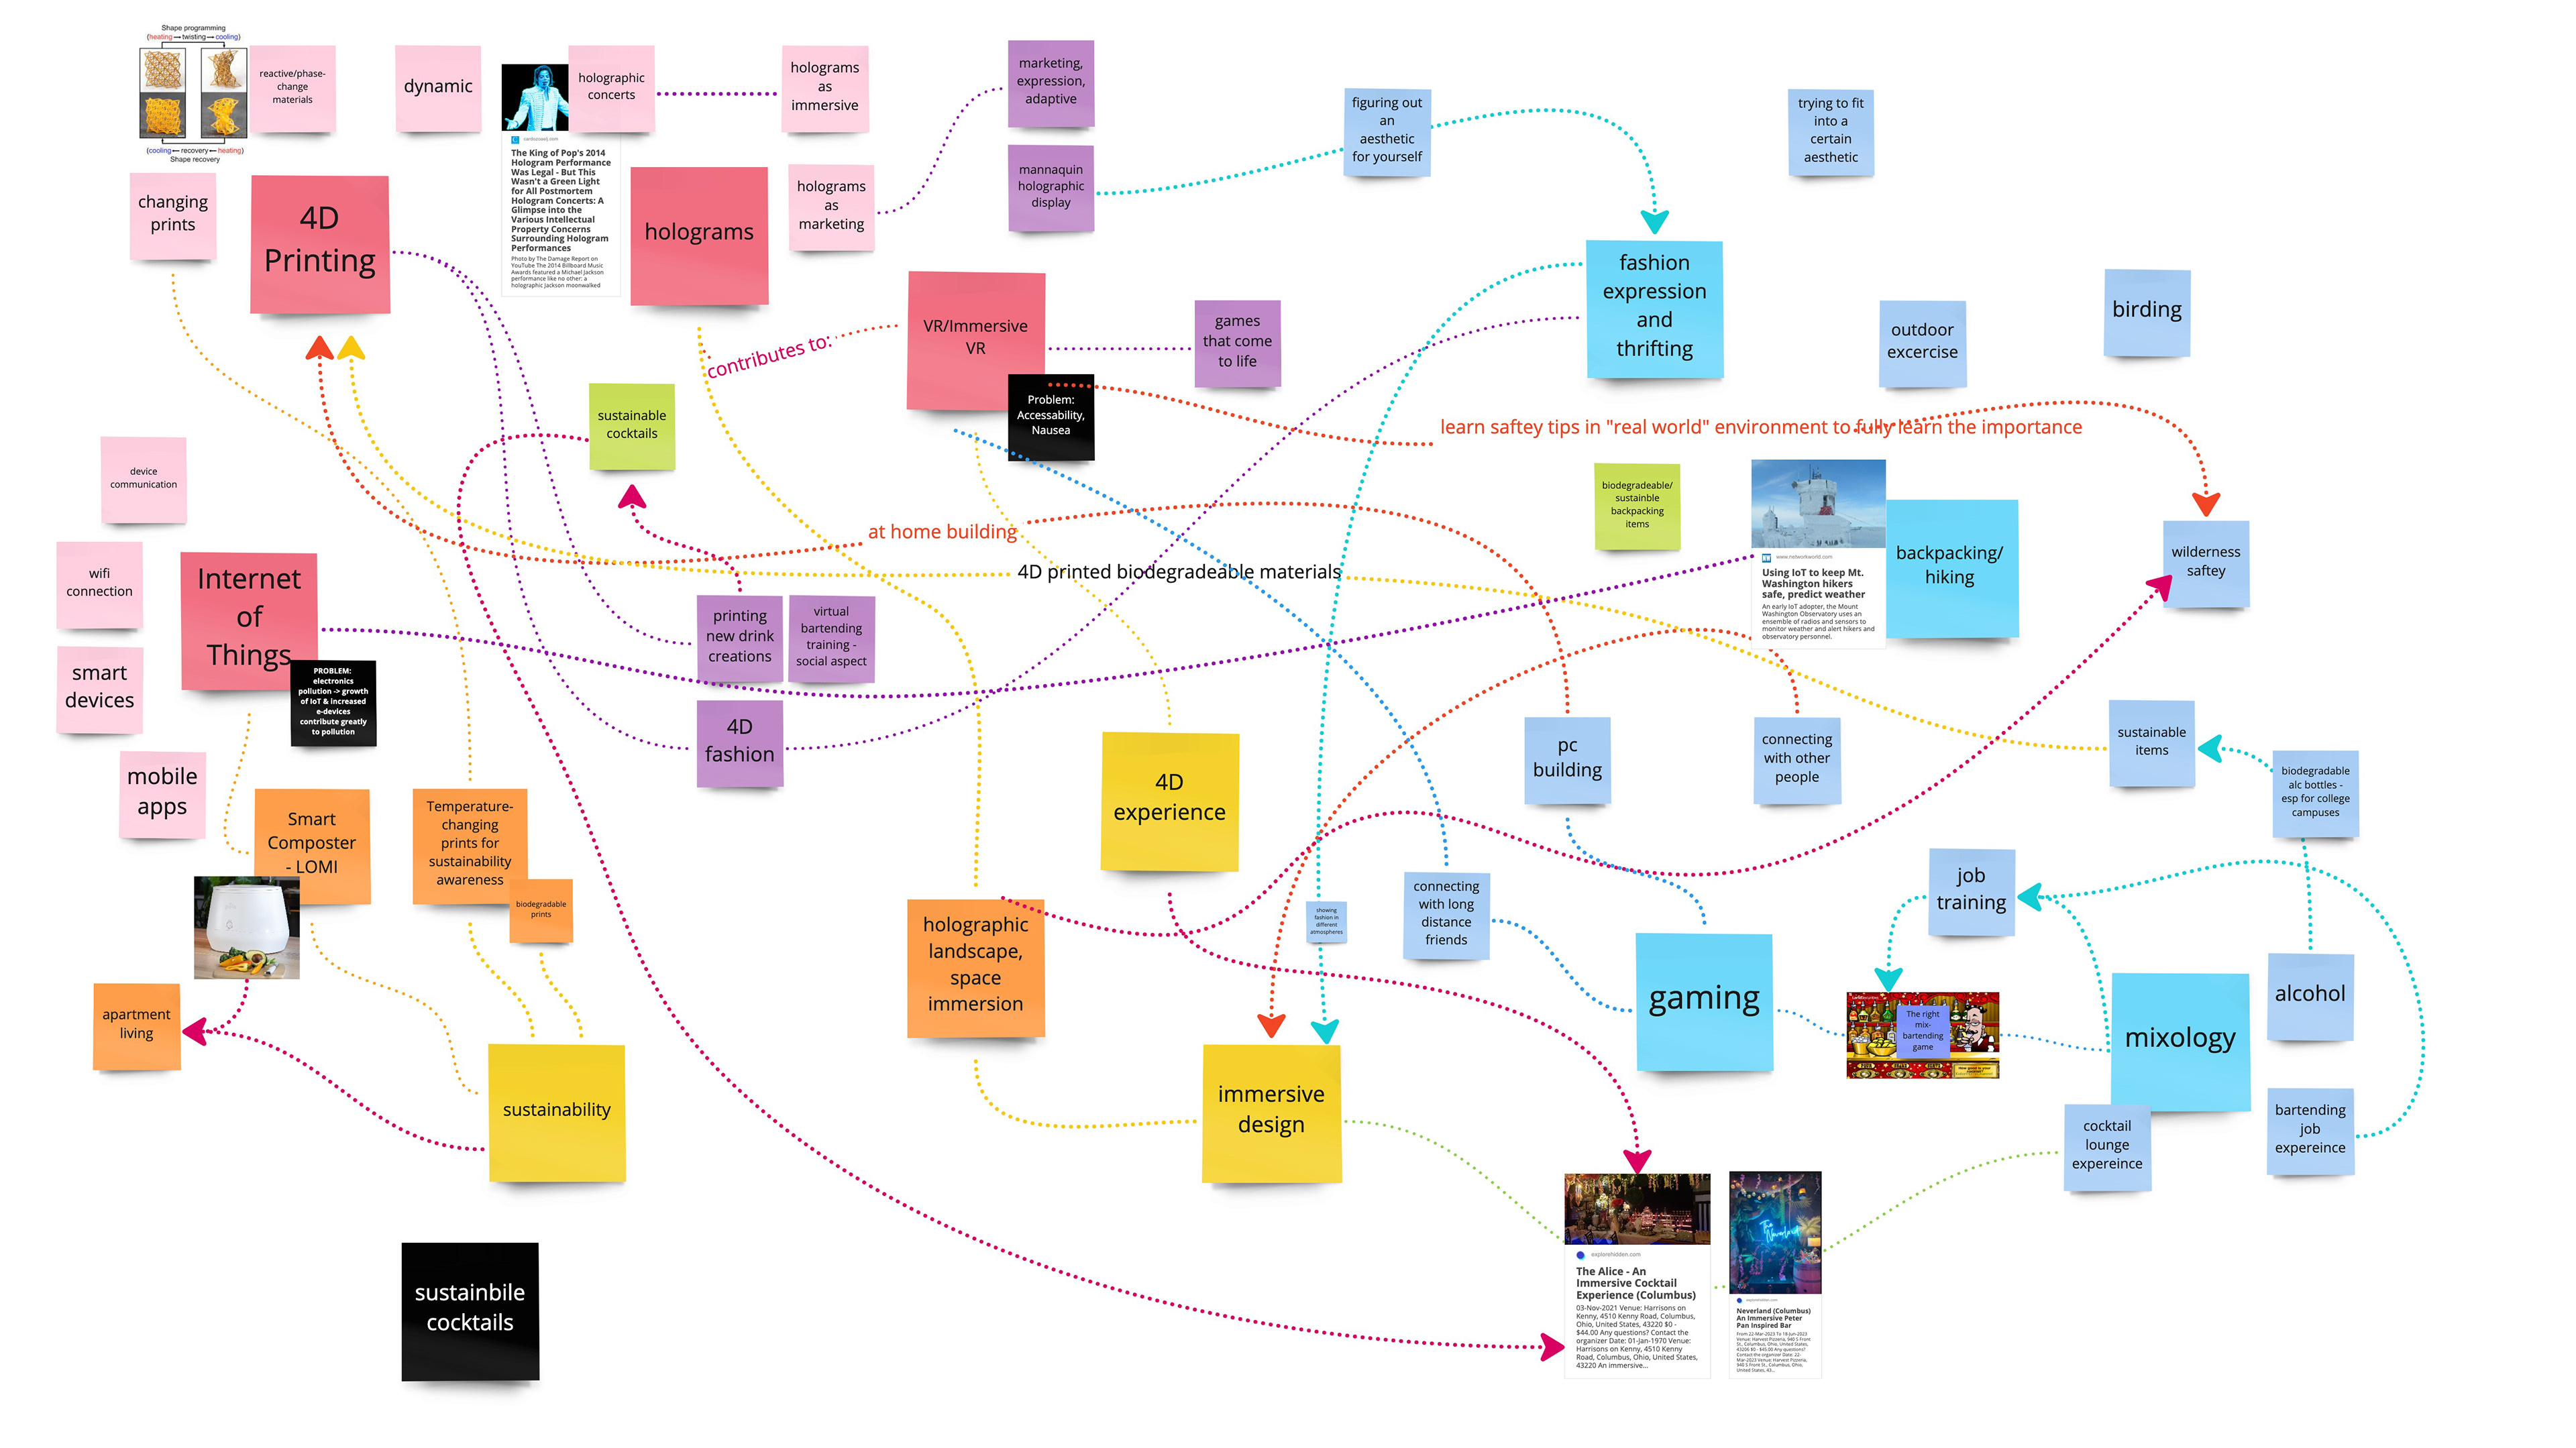
Our organizing week occurred in several phases. We first made a Venn Diagram that sorted our topics into the three categories of emerging technology, design topics, and interest. We then tried to find connections between the categories and the topics within those categories. Because we were still brainstorming, we found that the Venn Diagram was too structured and made it harder for us to make connections between all of our topics. We then moved on to a method that was much messier but more freeing. We labeled it a "Connection Cloud" where our topics were still sorted into their categories by color, however, we were able to move the topics around the board to make more connections.
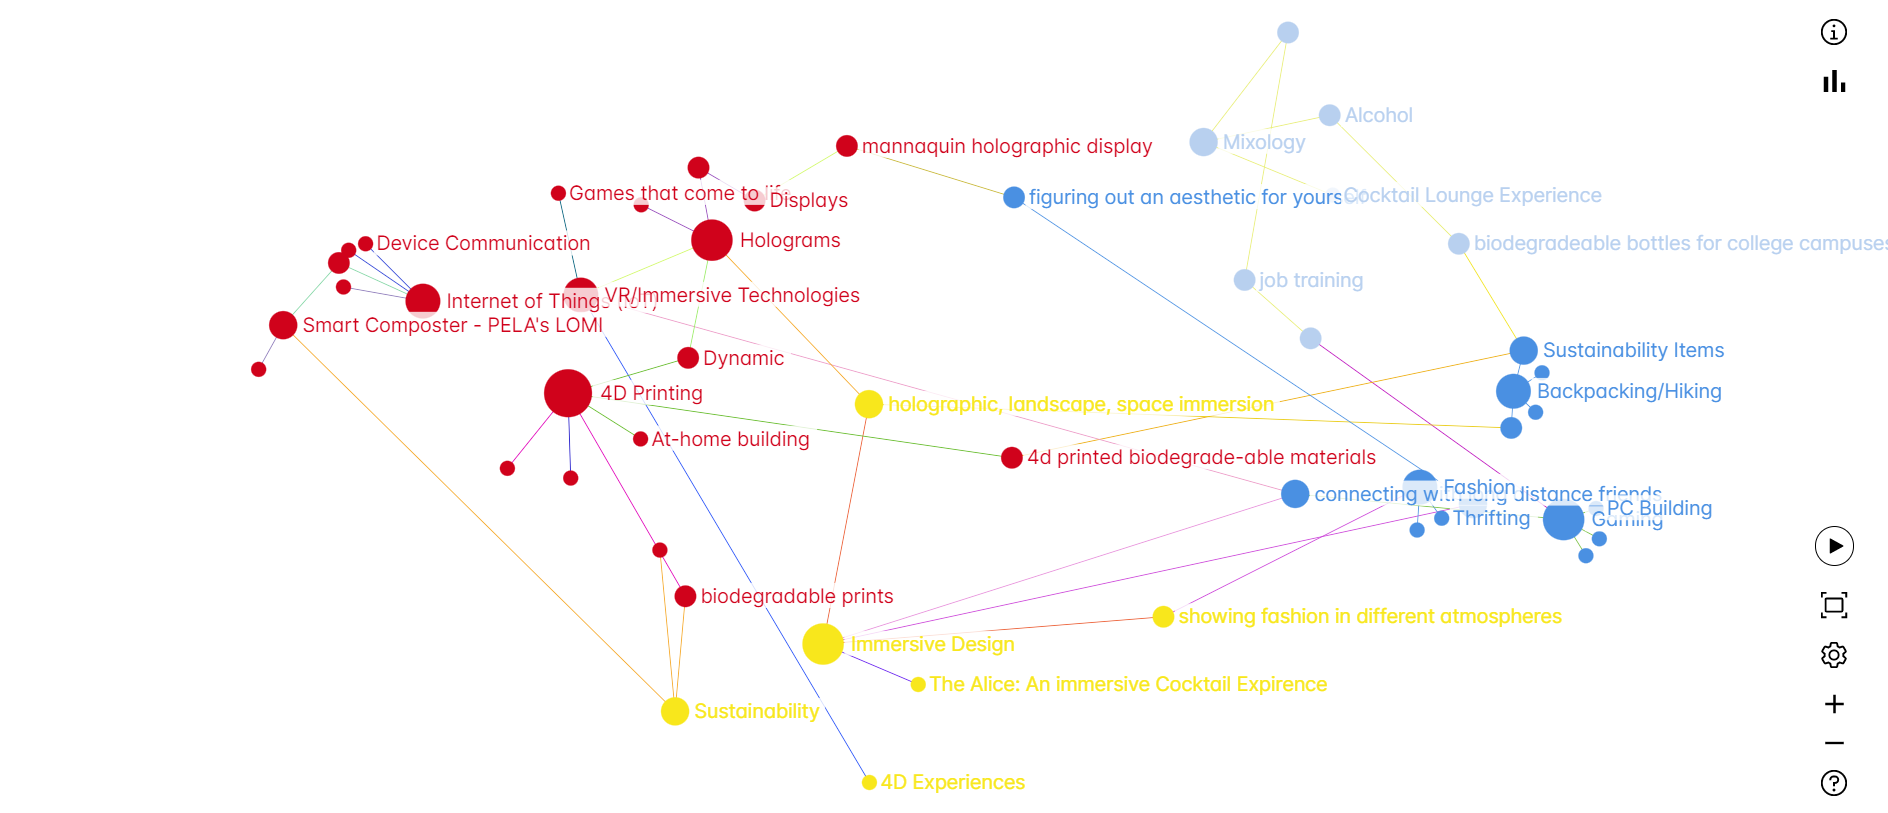
Toward the end of the week, we began thinking about how we were going to present our exploration. We thought about doing an infographic-style chart that would have our topics sorted into new categories. To visualize the new categories we put our Connection Cloud information into Graph Commons. This allowed us to visualize what topics contained the most connections.
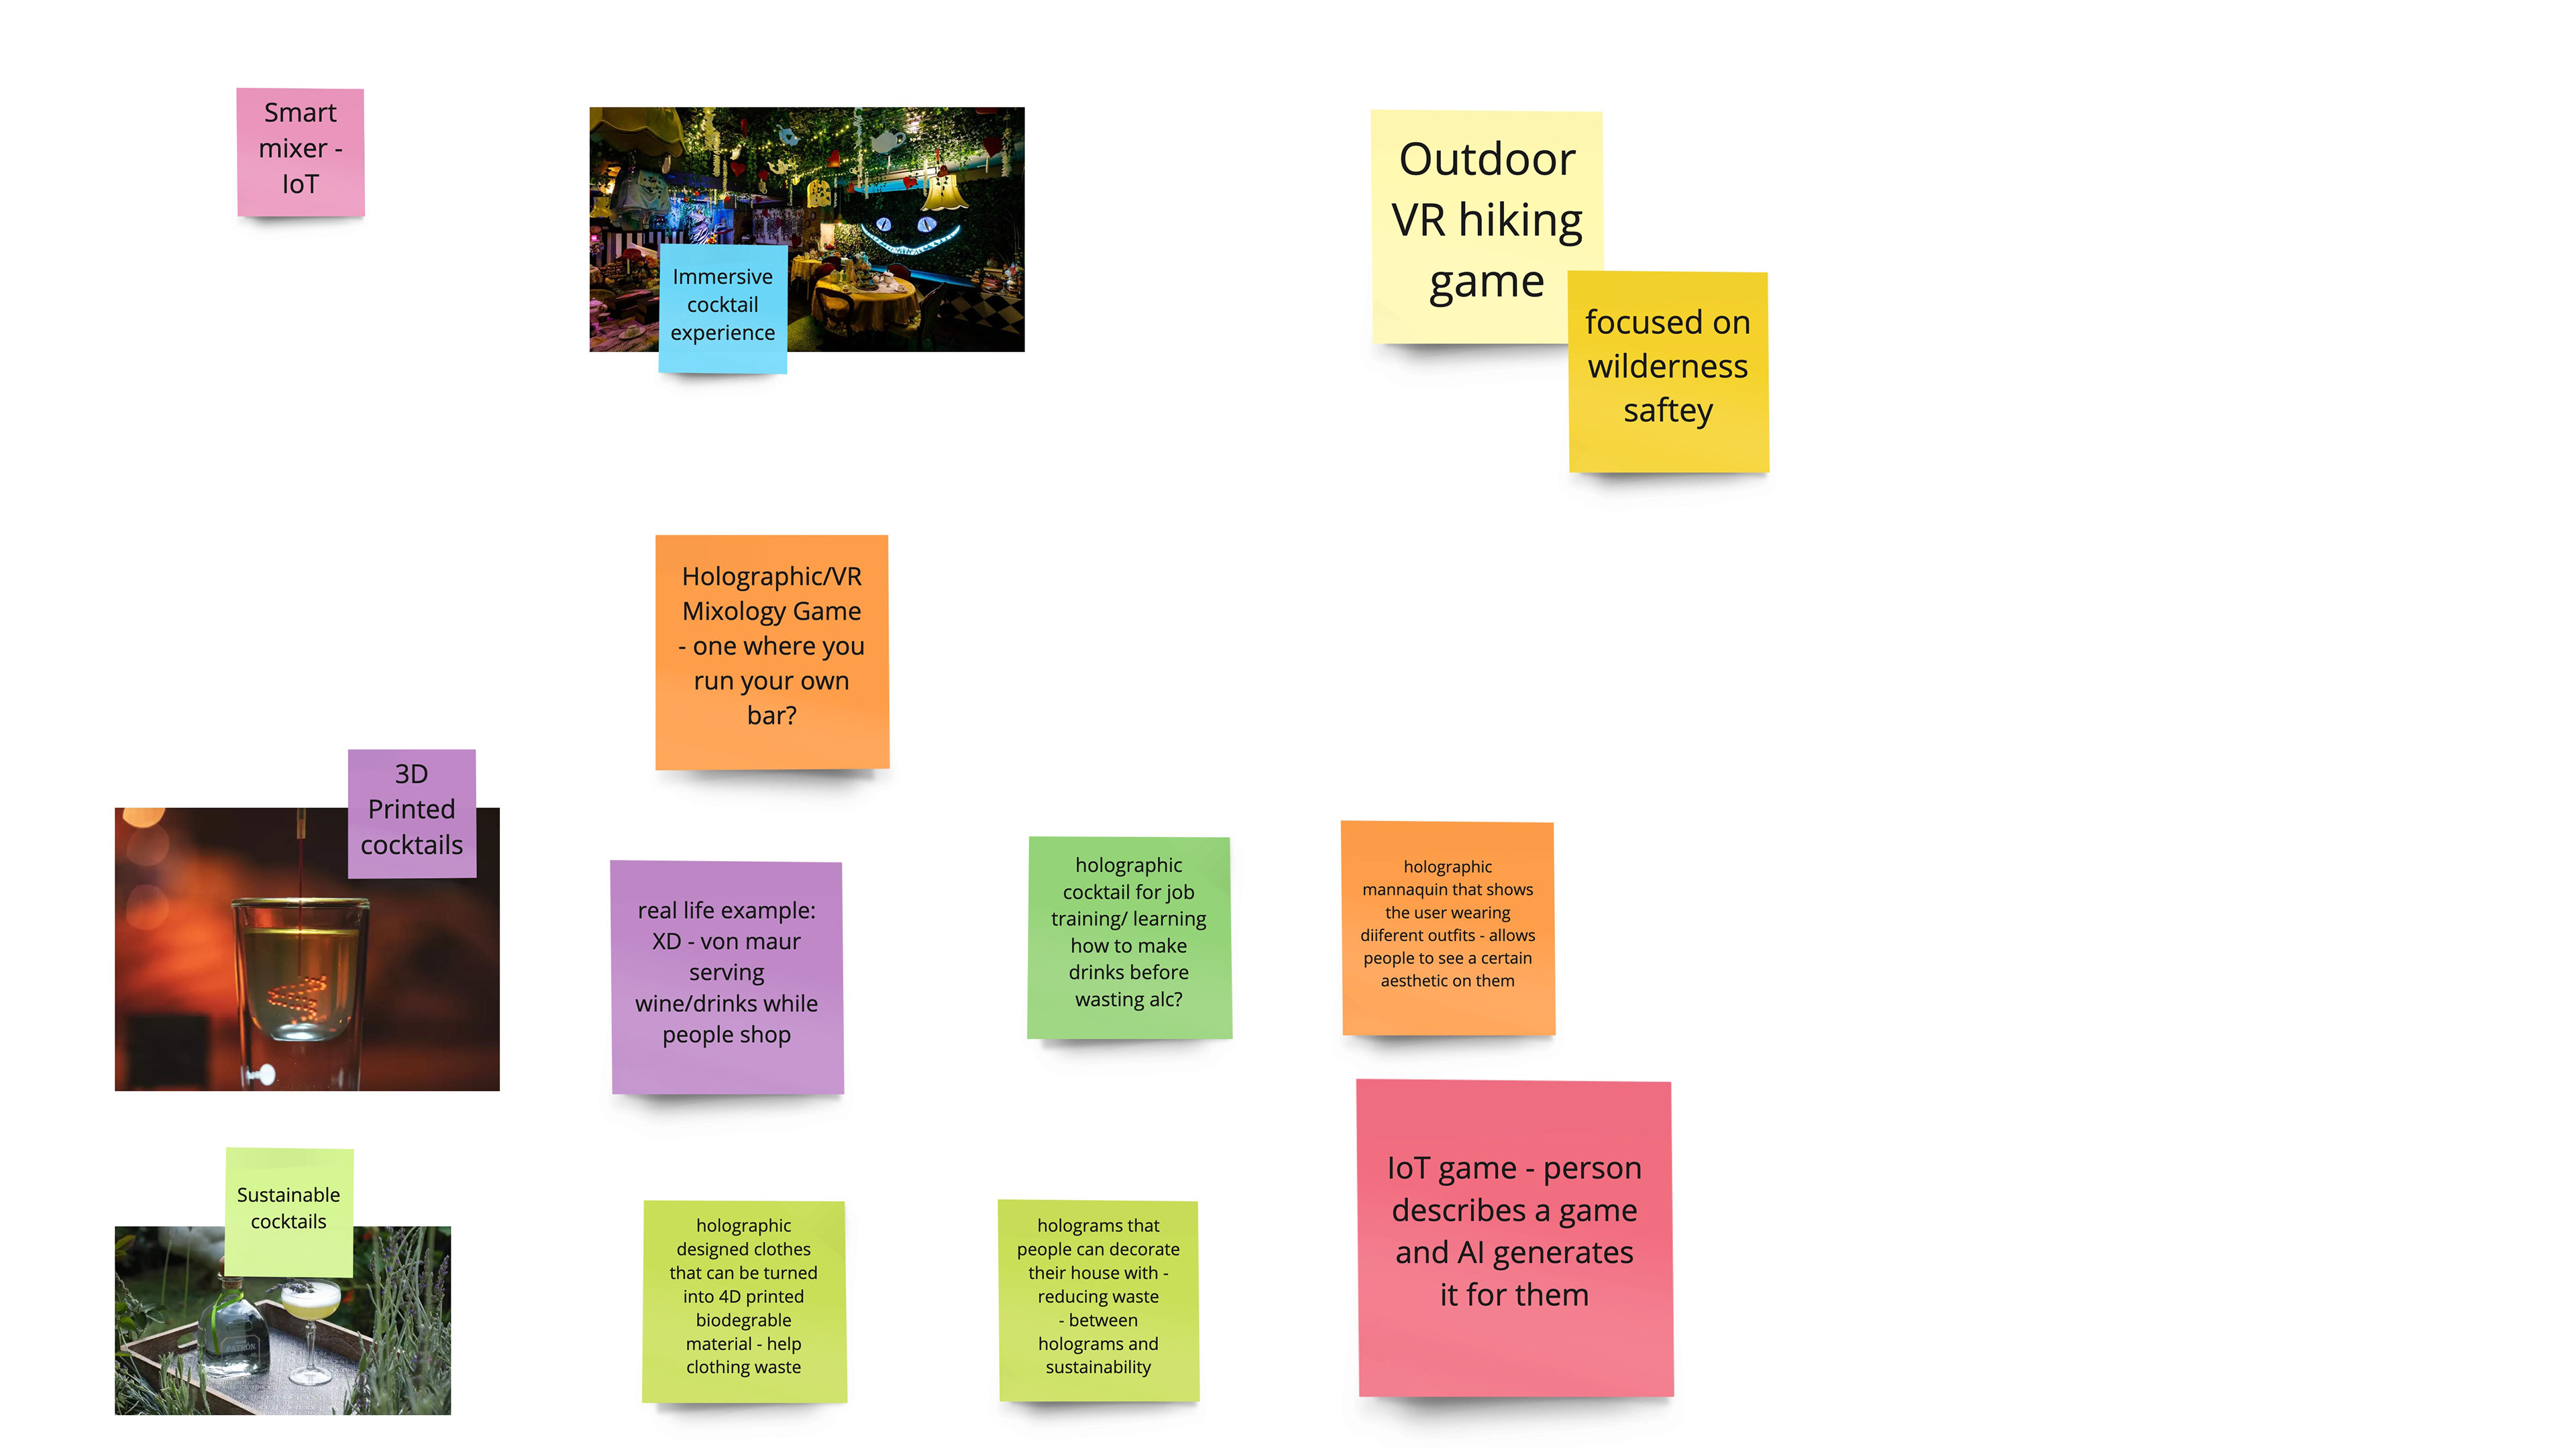
At the end of the week, we reworked our infographic idea and decided to create a presentable based on a topic we were all interested in: mixology. For this, we started noting what connections we made between our topics, and thought about how we could relate them to mixology.
Ideating a Presentable
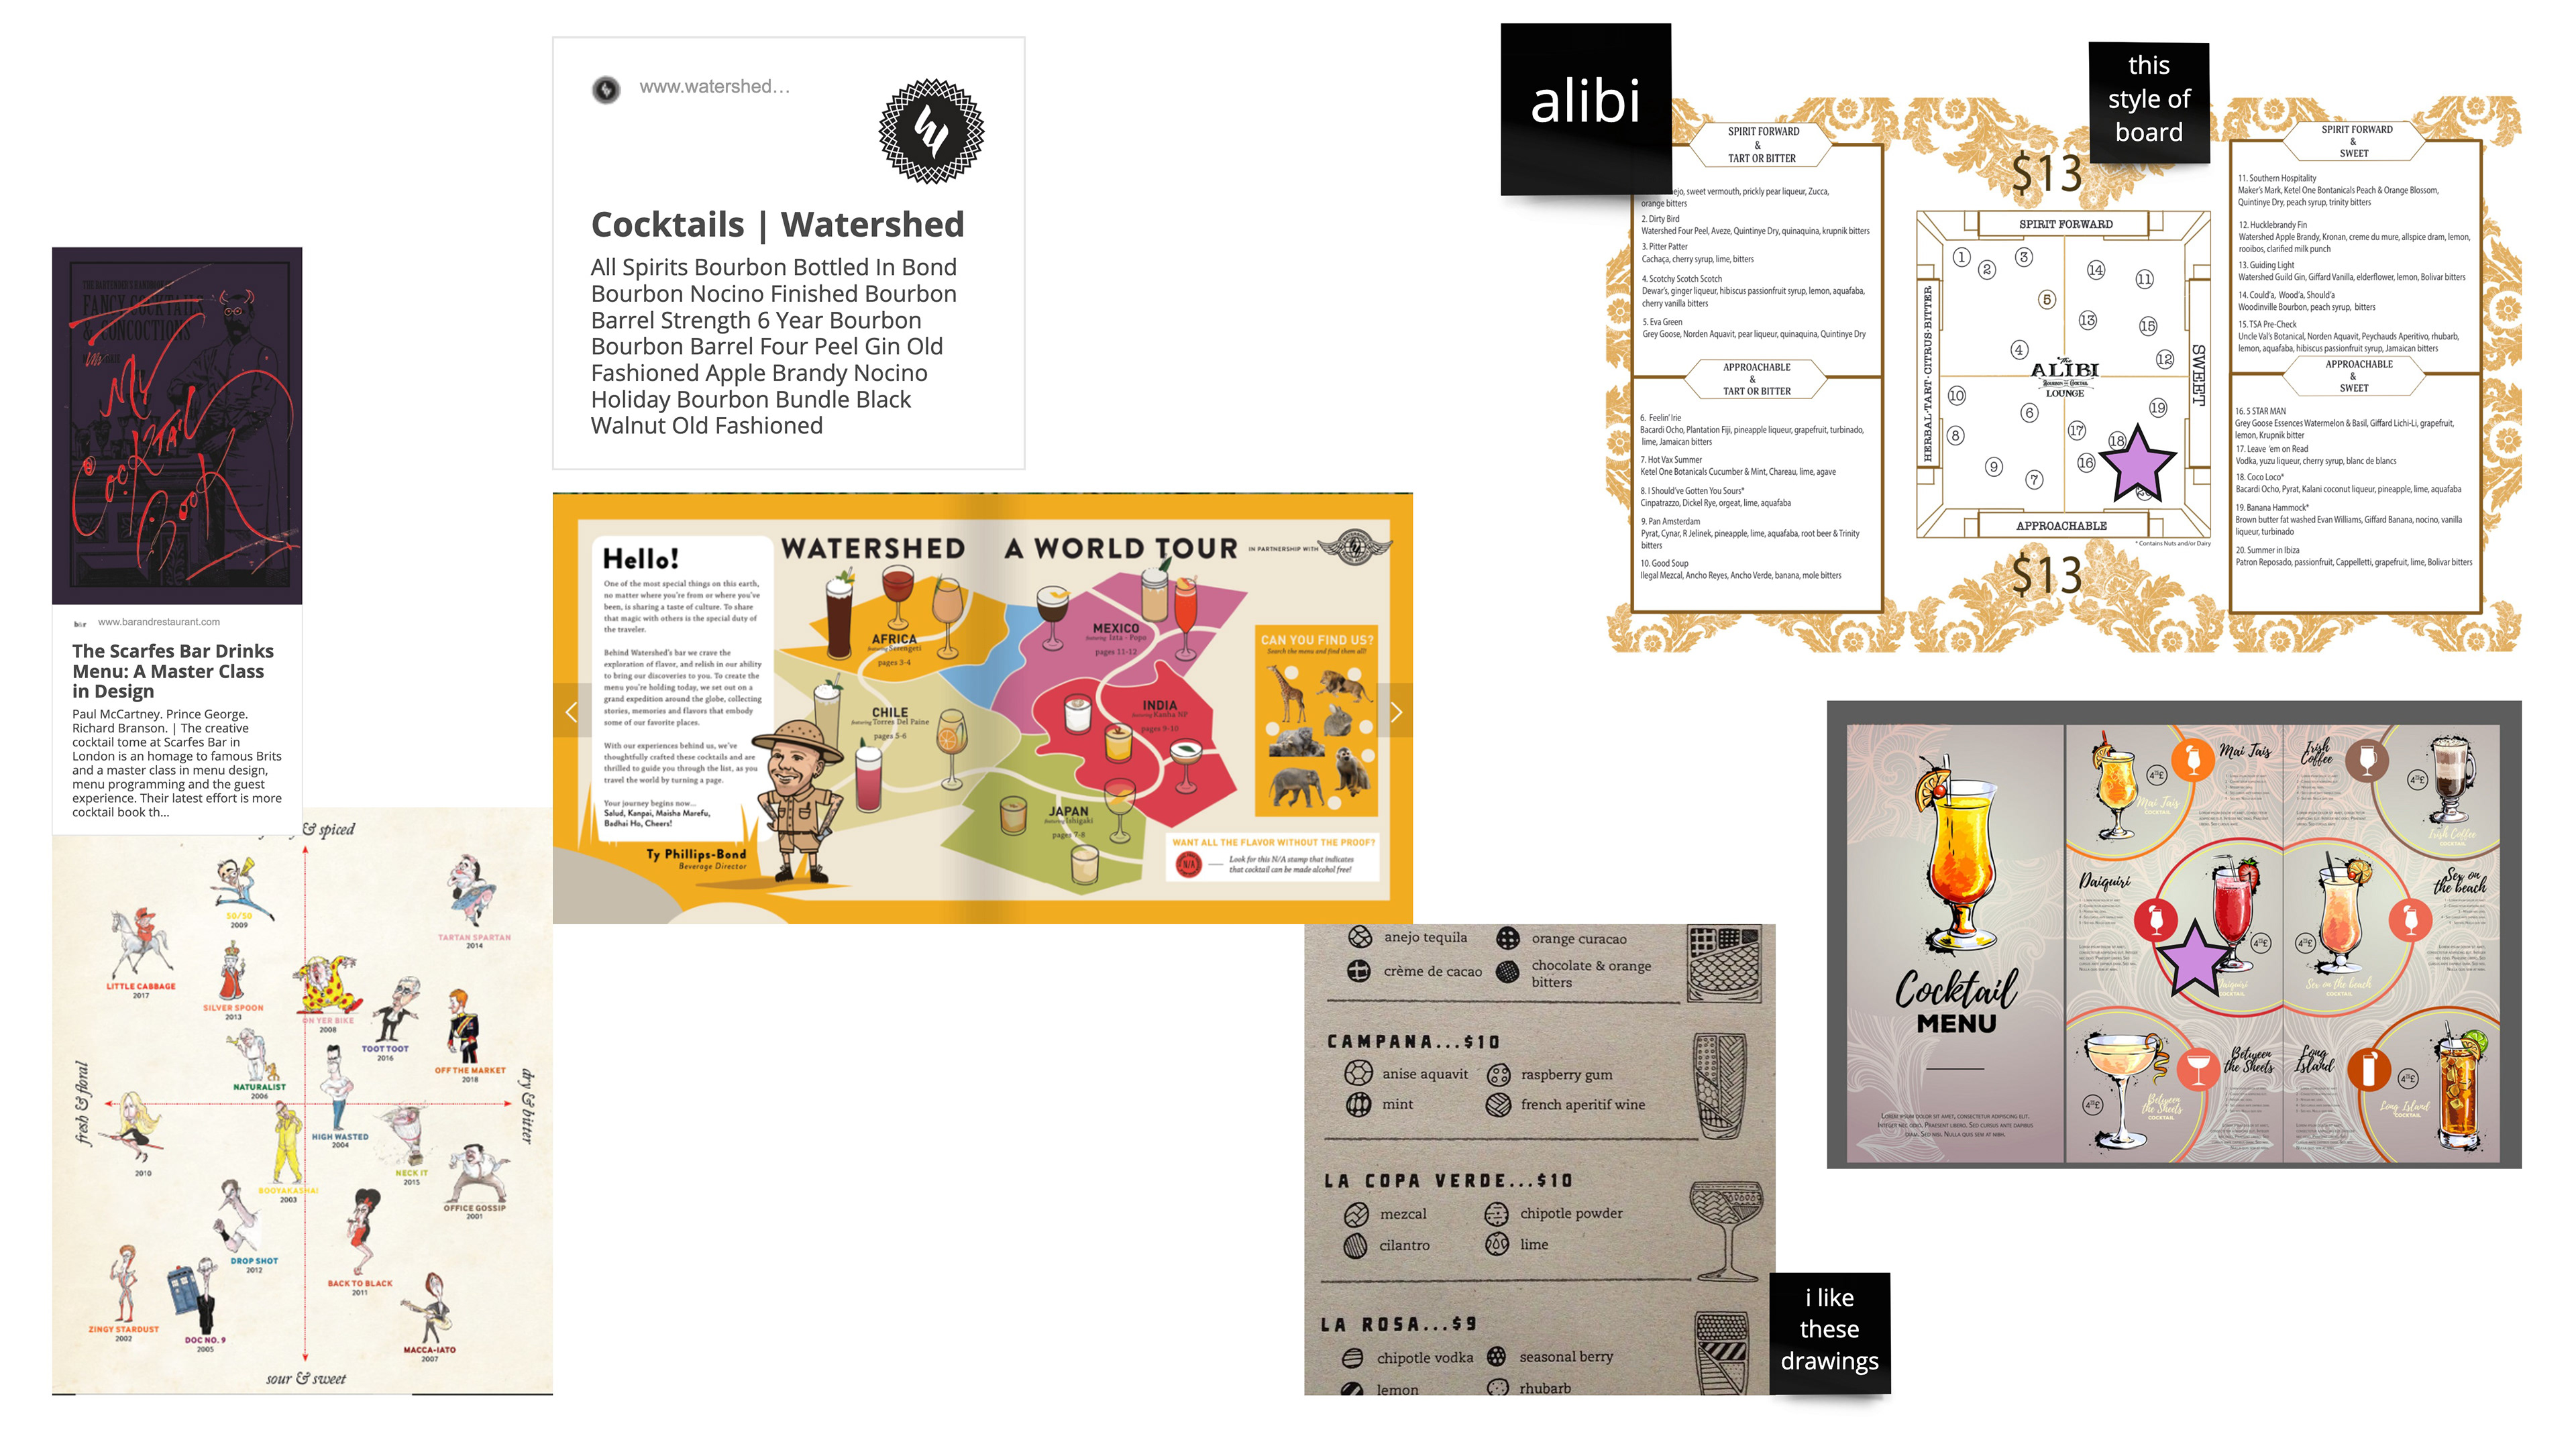
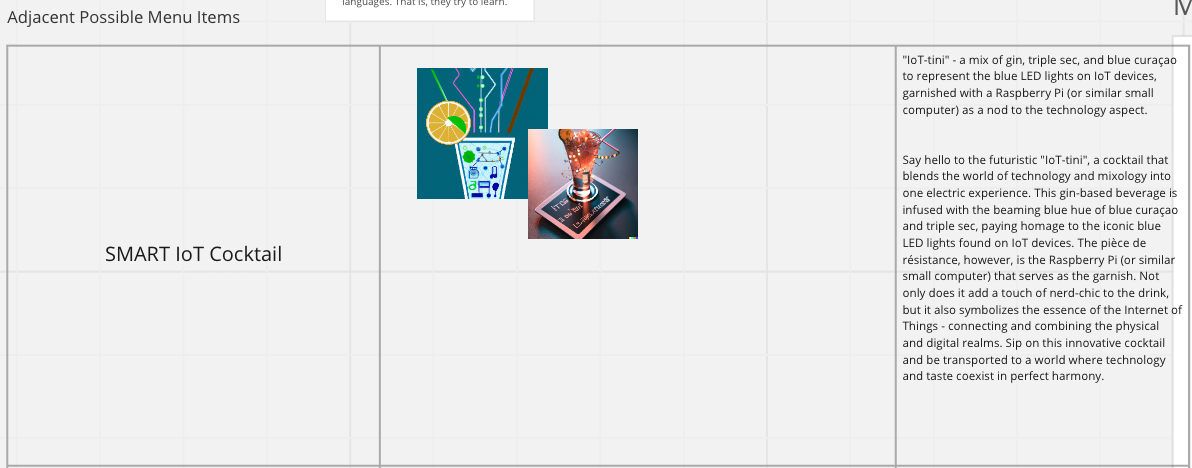
Our final idea for a presentable was a cocktail menu. We found templates from the internet that we liked, and I also pitched in a menu that stood out to me from a cocktail bar called The Alibi. We decided to go with the Alibi-style menu due to the chart in the menu. We then organized our connections into the chart. We used ChatGPT and Dall-E to create the cocktail names, ingredients, descriptions, and images.
One challenge that we had at this point was learning how to communicate with the AIs in order to get the outcome we were looking for. I found that I had to be very specific and descriptive with Dall-E, while ChatGPT was able to produce the desired outcome almost right away.
Final Presentation
Below is our final PowerPoint about The Circuit Bar.